|
Advertisement / Annons: |
My astronomy project:
|
|
Content: |
|
1: Introduction star color databaseIt's common to use G2 stars for color calibration of astrophotography. But that gives very few stars right enough, better to use a wider range of stars. Long time ago I had the program Redshift, think it was version 2. With that I could be directly filter out the stars I needed, example a special spectral class for use to color calibrate a astronomy photo, very advanced for its time. My goal with this project is to make a catalog with star colors linear relation between red/green and blue/green and use it in CdC http://www.ap-i.net/skychart/en/start. There are a lot of star databases on the internet with star data, from them it's possibly to filter out needed data to make an own star catalogue. But has it ever happen to you that all the time you spent to learn things, suddenly you don't remember it anymore? Lucky me there is a lot of help on forums. Hans Bengtsson, Thomas Karlsson and Johan Warell on the forum http://www.astronet.se/ (Astronet, a Swedish forum) provide me with information that I needed. One very big database with a lot of spectral data is the UCAC4 catalogue. Here are some useful links:
Update:
|
2: Downloading star color database for CdCThe data I have filter out is the Wavelengths:
From this I only selected stars that are stronger than magnitude 10 and where 0.3 < B-V < 0.9. I will say it's rather complicated to do this because of the huge amounts of data. Also to get Excel to interpret the data correct isn't so easy either. Then you have to transform it to a standard that CdC can read, hours and hours of work. The magnitude relation: G-I, G-R and B-G has been transformed to linear calculation I/G, R/G and B/G. Not an astronomical standard or a photographic standard either. But with the linear relation you can compare with what you have in your own image, and then maybe if necessary calibrate it. Strange things about the green wavelengths, could not find any wave length information in the table, not good because this green channel is important. See this just as a experiment, don't spend to much time to do color calibration of it! Download: cal UCAC4 bgvriJHK mag10.zipspecial for CdC.
Version 20150327 When you have the CdC star program installed you can unpack and add this directory on your hard drive and then adding it to the CdC.
Here is a screendump of how CdC looks with this star color database activated: 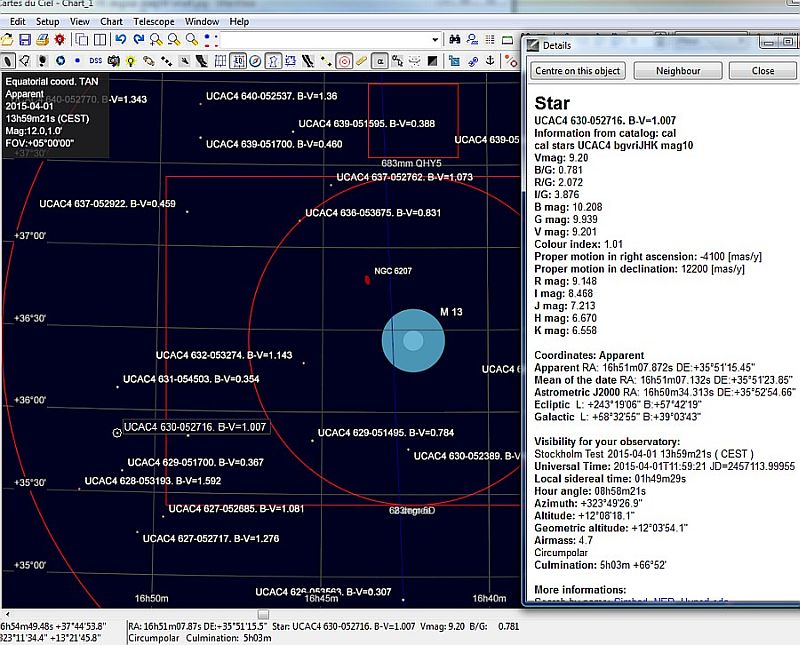
Just right click on a star and you get the data for it. The star color database just cover 45 degree around M13, you must no have more than a 10 degree field to se the stars.
|
3: How to use this color informationHere I will do a color calibration of an image of M13, a globular cluster. 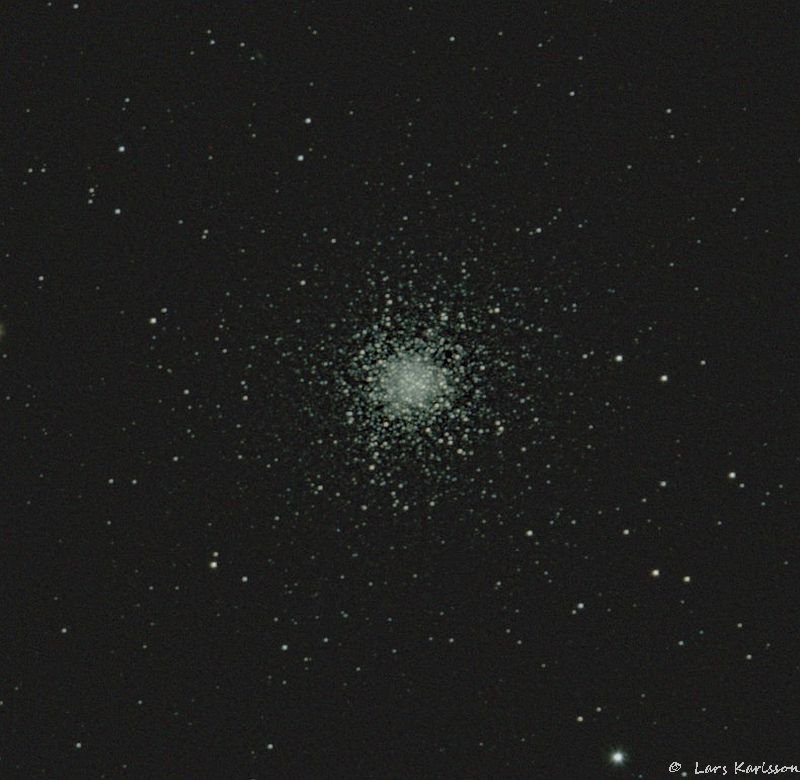
Before calibration: I have set the gain for the r,g,b channels to 1. And done darks, and flats calibration. Set the black point. Important, no nonlinear function as logarithmic or gamma. As expected, quite green because the camera (Canon 5D) is most sensitive here in the green wavelengths. 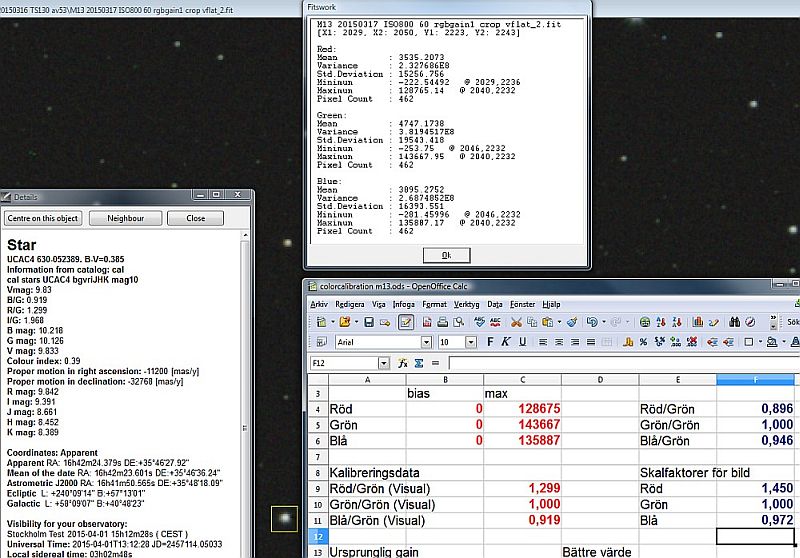
I took a star with B-V pretty close to zero as a reference to not deviate too much from a "white" star. Very important, it's shall not be oversaturated! The yellow box is from Fitswork, right click in it and you get statistics. In the box we get maximum value for each channels, of course it should have been mean integrated values all over the star, but Fitswork doesn't have it implemented. These scale factors applies to the camera and telescope together. If you put there another flat field corrector or move the camera to another telescope it will require a recalculation. If the atmosphere provides a filter (coloring) that deviates from the norm, it also affects, for example low elevation angles. 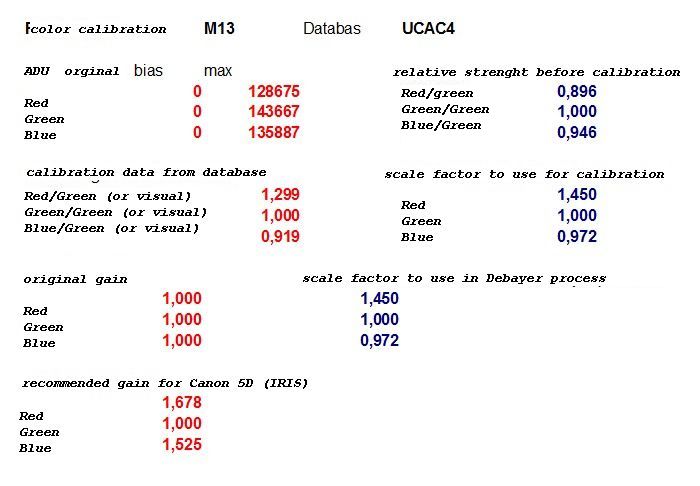
I have put in those values in a excel chart to calculate how I should scale red and blue channel relative green.
As seen the red channel shall be scaled 1.45 times and the blue 0.97 times. Notice also the scale values that are recommended for this camera. The blue channel deviate a lot, it's because of my little to simple measurements. 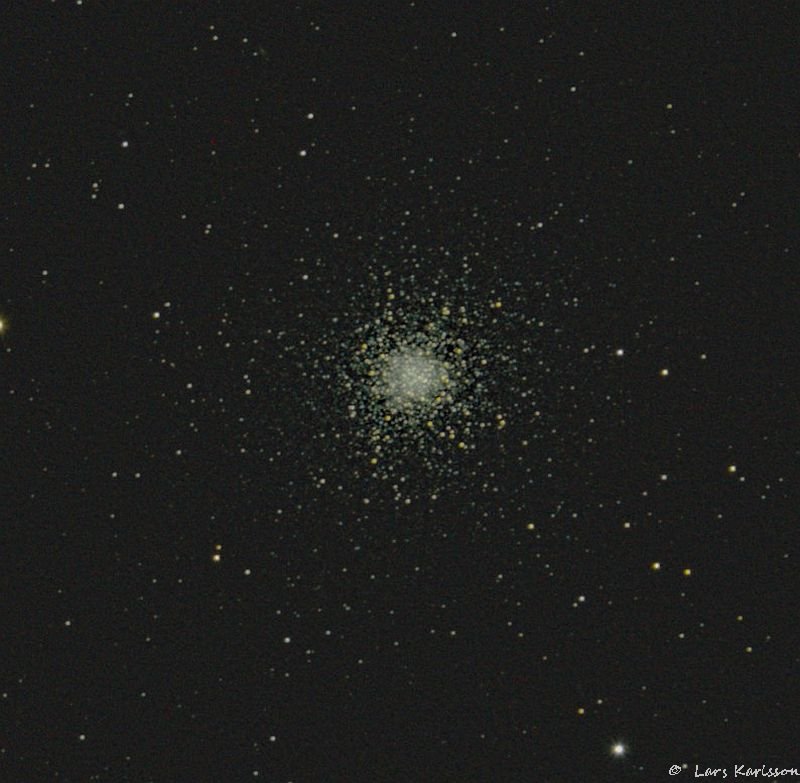
Here is the result of the calibration, I have made a new background flat and increased saturation of 20%, to emphasize the colors better. Maybe not so stupid, missing a little bit more blue, in any case, the closest so far from how they usually look out from the observatories, you have to trust they reproduce the real colors, and not just how it looks prettiest. But as I wrote in the previous thread, are not really sure of what green magnitude represents. To use the maximum values are not good, but the only thing I have available at the moment. Moreover, one should have more stars values to get better statistics. This is of course now a very simple calibration, you can go how deeps as possibly in this. But fun in any case that the color has a connection to measured values from a high precision database. Concentrating now on the program http://larryo.org/astronomy/software/unimap/ Unimap and try to understand how I can utilize it. With the help of Unimap I would in principle be able to identify reference the stars directly on the photo, which would facilitate a lot. There are of course programs that can do this almost automatically.
|
| Go Back |